
Public and port lighting
Intelligent Street Lighting
Smart street lighting for municipalities and ports: less energy, faster repairs, one screen
Street lights that report their own faults before a resident calls, and dim by the hour to save energy and maintenance costs. We connect street and port lighting to one control screen, with every fault on the map and energy measured by area.
3 named lighting projects
Street lighting in Santorini (Municipality of Thira) · Port of Thessaloniki · Municipality of Korydallos
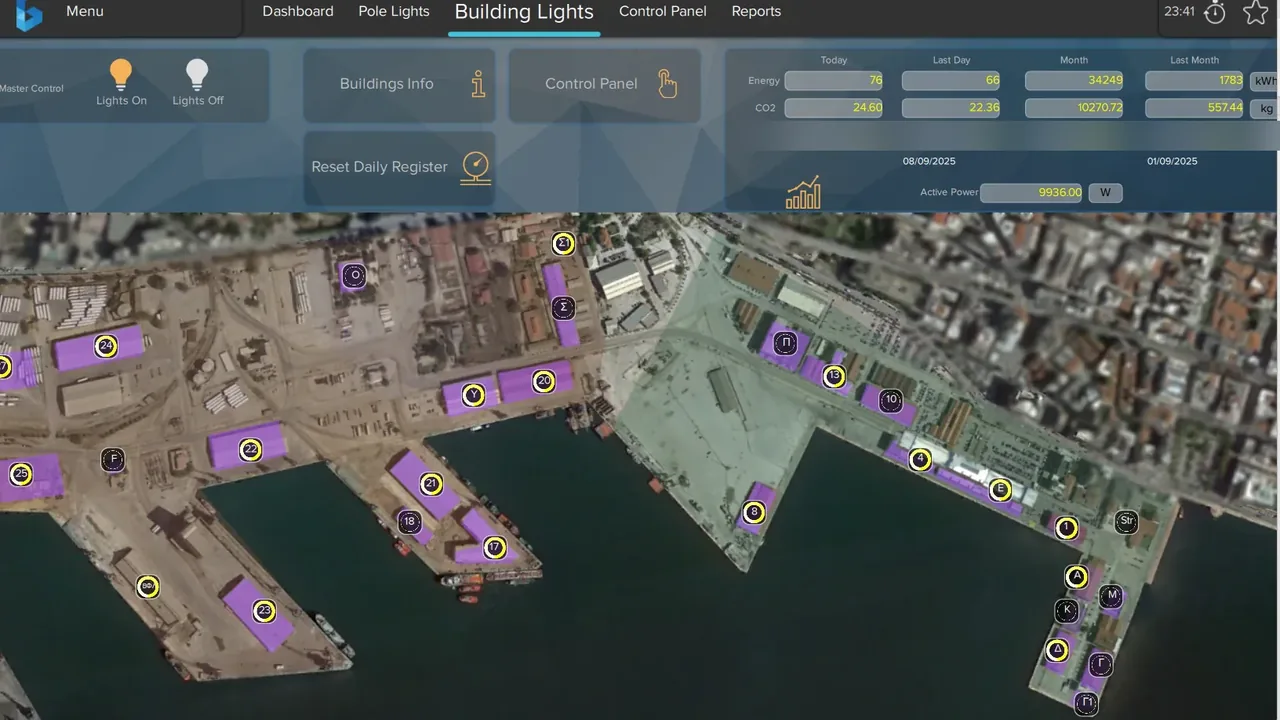
Switch every light in the area on or off with one command.A separate view for the port’s pole lighting.Energy and CO2 metered by day and by month.Every building on the aerial view is a control.
Delivered forCities & Infrastructure
- Port of ThessalonikiLighting control and energy monitoring for the port
- Municipality of ThiraStreet lighting in Santorini, each supply pillar on a digital register
- Municipality of KorydallosStreet lighting
The problem
Fixed timers, late repairs, hidden costs
Much public lighting still runs on fixed timers at full power, whether a street is busy or empty. A failed light is often found only when a resident calls it in, and crews lose time locating it. And because lights are rarely matched to the supply pillars, the street cabinets that feed them, nobody knows what each street really costs.
- Faults stay unseen until someone complains.
- No single map of the poles and supply pillars.
- Energy is billed, but not measured where it is used.
Industry context
Up to 60%
Public lighting accounts for up to 60% of a typical municipality’s electricity costs.
Finding of the European Commission’s report on solid-state lighting for European cities, “Lighting the Cities”.
Outcomes
What you gain
Four things a lighting department notices first: the crews, the energy bill, the records and the reports.
Faults found before residents call
Failures appear on the map with their location, so crews go straight to the right place instead of patrolling for dark streets, and every fault is logged.
Lower energy use, street by street
With LED lights and central control, each street gets light only where and when it needs it, at the right level.
A network on record
Every pole and supply pillar on one map with its details, so any crew finds what it needs.
Energy and CO2 you can report
Energy and CO2 by area, by day and by month, ready for your reports.
Industry context
Almost 46%
Lights that dim automatically with sensors use almost 46% less energy than the same installation left undimmed.
A night on the network
From dusk to dawn, street by street
Six moments in one night, each shown on real control screens from street lighting in Santorini and the Port of Thessaloniki. Scroll, or pick a moment.
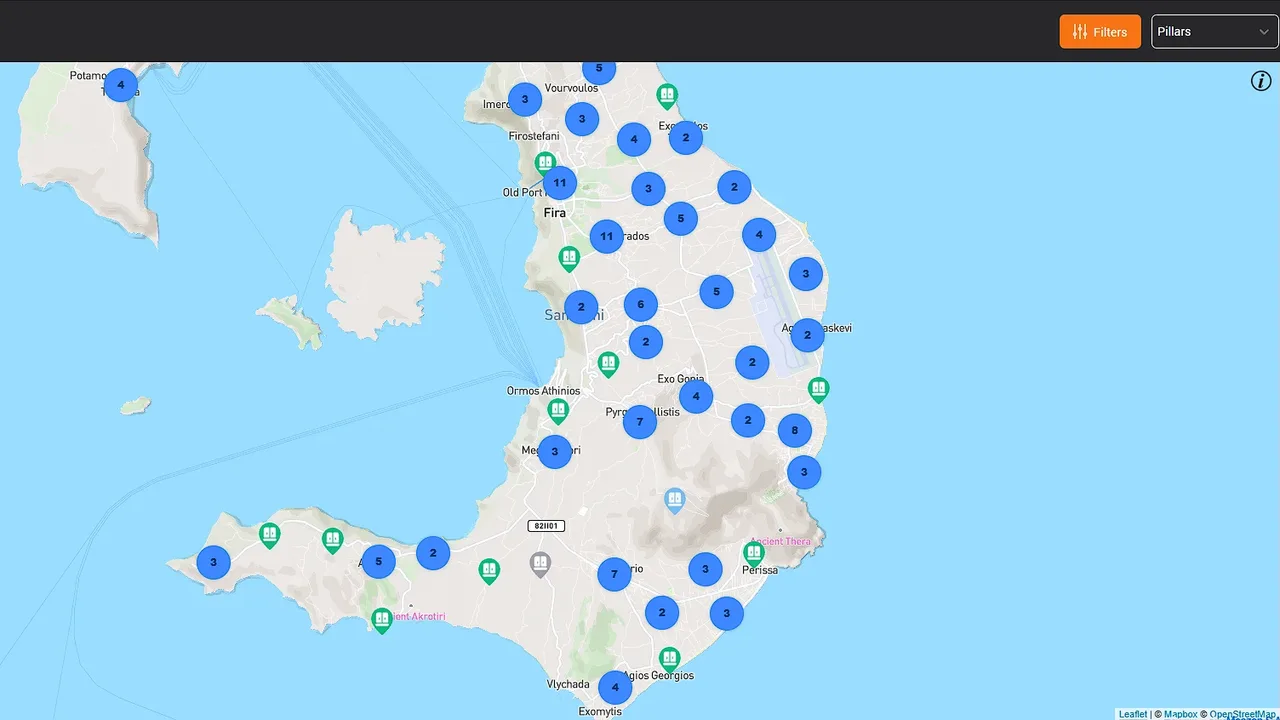
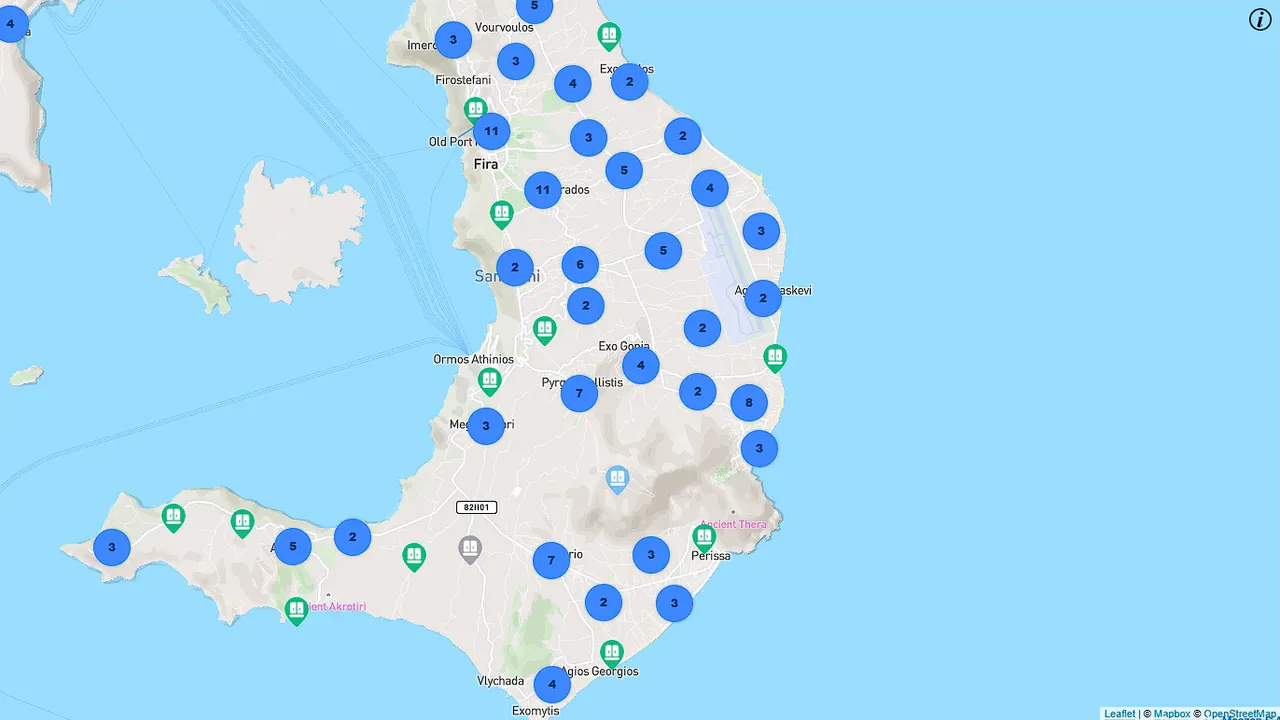
Port of Thessaloniki · Master Control, with Lights On and Lights OffStreet lighting in Santorini · supply pillars on the network mapStreet lighting in Santorini · a single supply pillar on the mapStreet lighting in Santorini · the Pillars layer and its filtersPort of Thessaloniki · energy and CO2 for today, last day, month and last monthPort of Thessaloniki · building lights on the aerial view
What we automate
Everything a lighting network needs, on one system
Street and port lighting first, then the city devices around them, built for your network.
Street lighting control
Switch, dim and schedule lights by street or area, from one screen.Fault alarms on the map
Crews go straight to the fault, because it shows on the map with its location.Dimming schedules
A busy summer and a quiet winter each get the light they need, street by street.Port and building lighting
Pole lights and building lights across a port, switched from one control screen, building by building.Energy and CO2 metering
Energy and CO2 by area, by day and by month, ready for your reports.Poles and smart devices
Poles that carry more than a light, on the same control screens as the street lighting.Crossings and traffic signals
Pedestrian crossings and junction signals, reporting to the same control screens as the lights.Every asset on a map
Every pole and supply pillar on a map with its details, so the network is easy to maintain.
Planning more for your streets? Intelligent Pedestrian Crossing Intelligent Lighting Poles Traffic Signal Control
See it working
Real control screens, and a dashboard to try
Two control screens from delivered systems, with what each part does. Then try the street lighting and port views of our dashboard demo.
On this screen
Interactive demo
The street lighting and port views of our dashboard demo. They start from the real readings; once you interact, the values are simulated.


Dashboard
Street lighting in Santorini · Supply pillars
Street lighting in Santorini
Supply pillars · Municipality of Thira
- OK
- Warning
- Fault
Selected supply pillar
South-east
Fault · not acknowledged
Dimming schedule · demo
- Dusk to 23:00100%
- 23:00 to 05:0050%
- 05:00 to dawn100%
Building lights
Port of Thessaloniki
Contact
Let’s talk about your lighting network
Send us the area, roughly how many lights or supply pillars you run, and any tender, funding programme or energy-performance contract involved. We will reply with how we would approach it.
Or write to us